

Why a 7.3% Cap Rate May Still Fail the Debt Test for Rental Property Investors
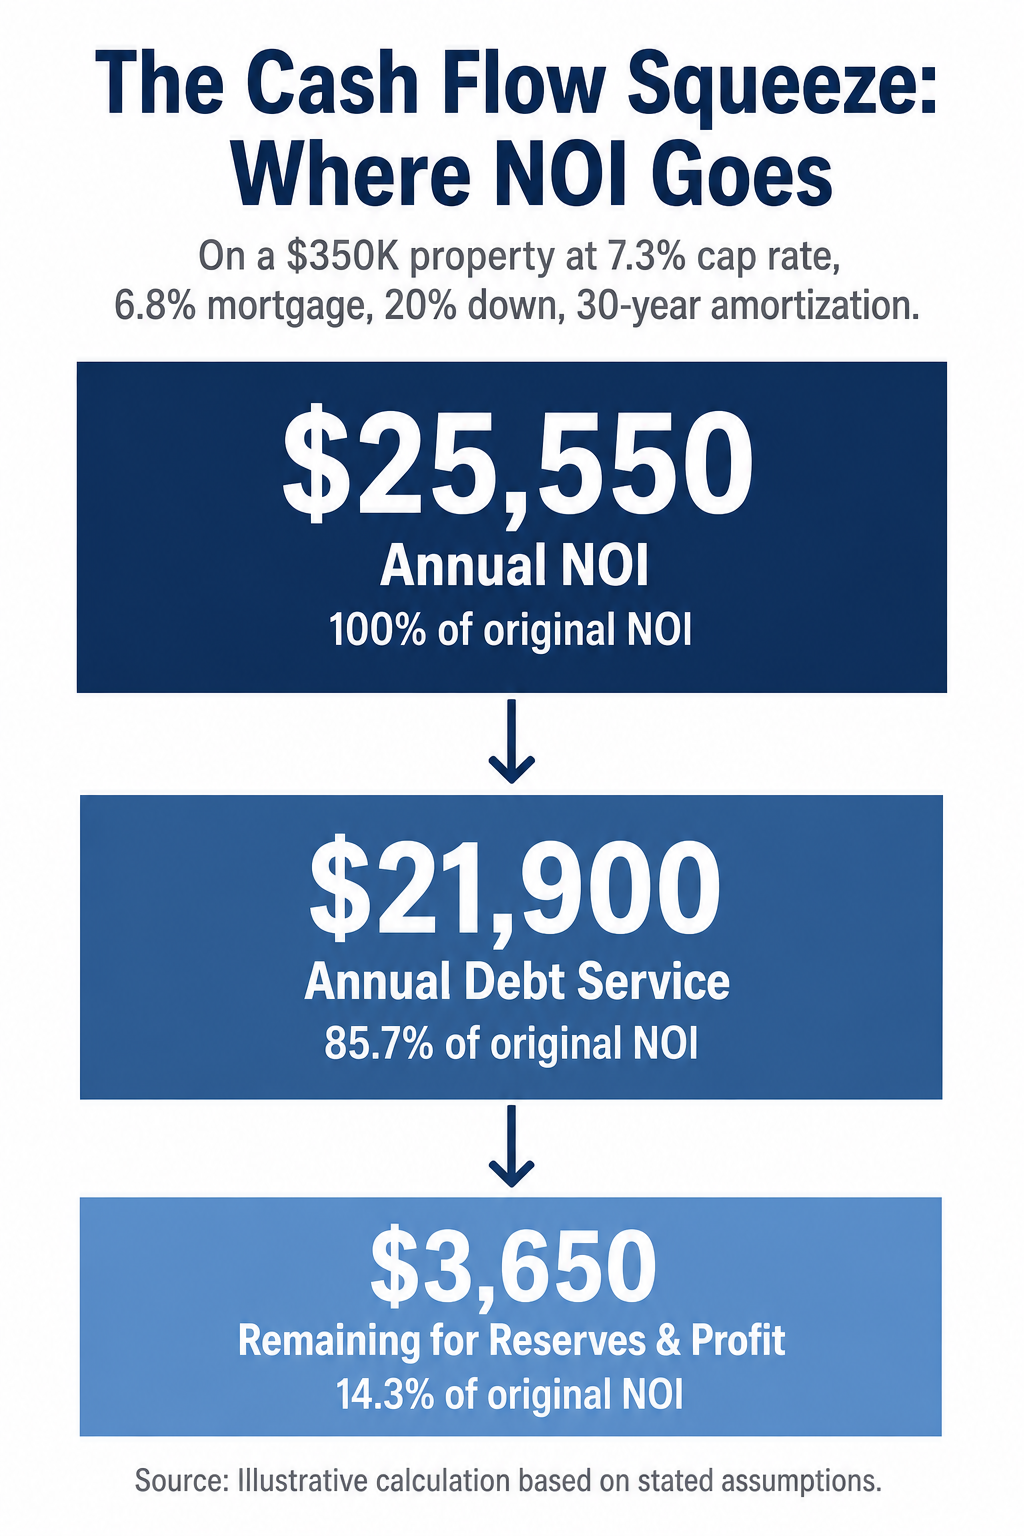
On a $350,000 property at 7.3% cap rate with 6.8% mortgage financing and 20% down payment, annual net operating income of $25,550 is consumed mostly by debt service, leaving minimal margin for capital reserves and profit.
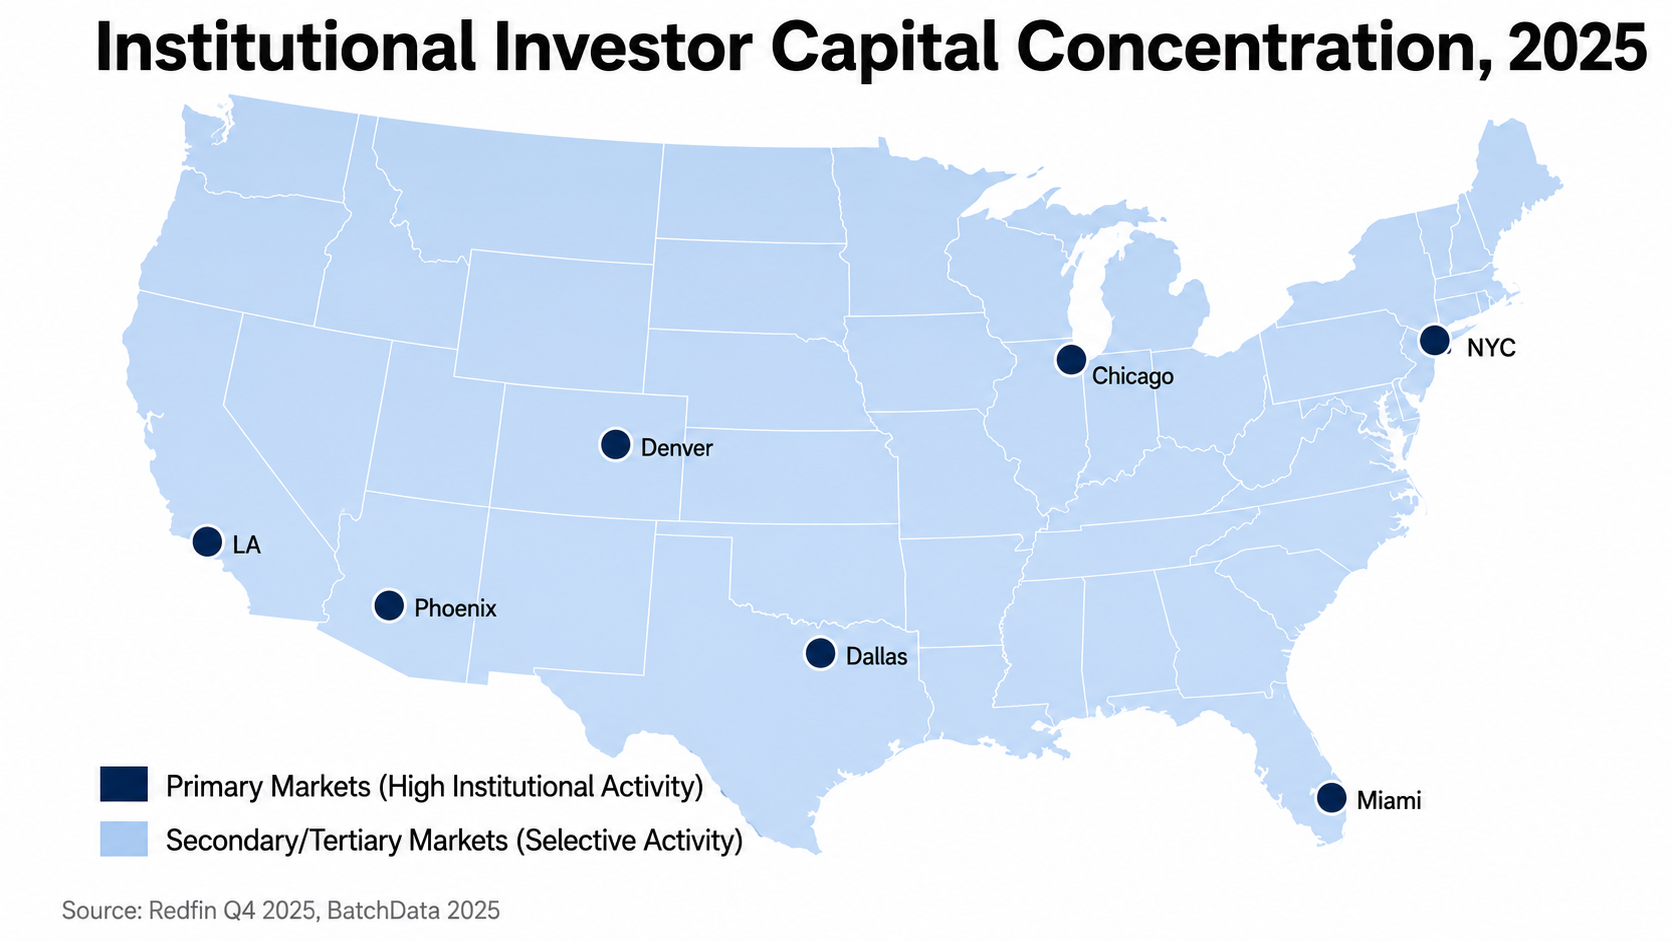
Institutional investors are concentrating capital in primary markets with strong fundamentals while reducing activity in secondary and tertiary markets where leverage economics are tightening..
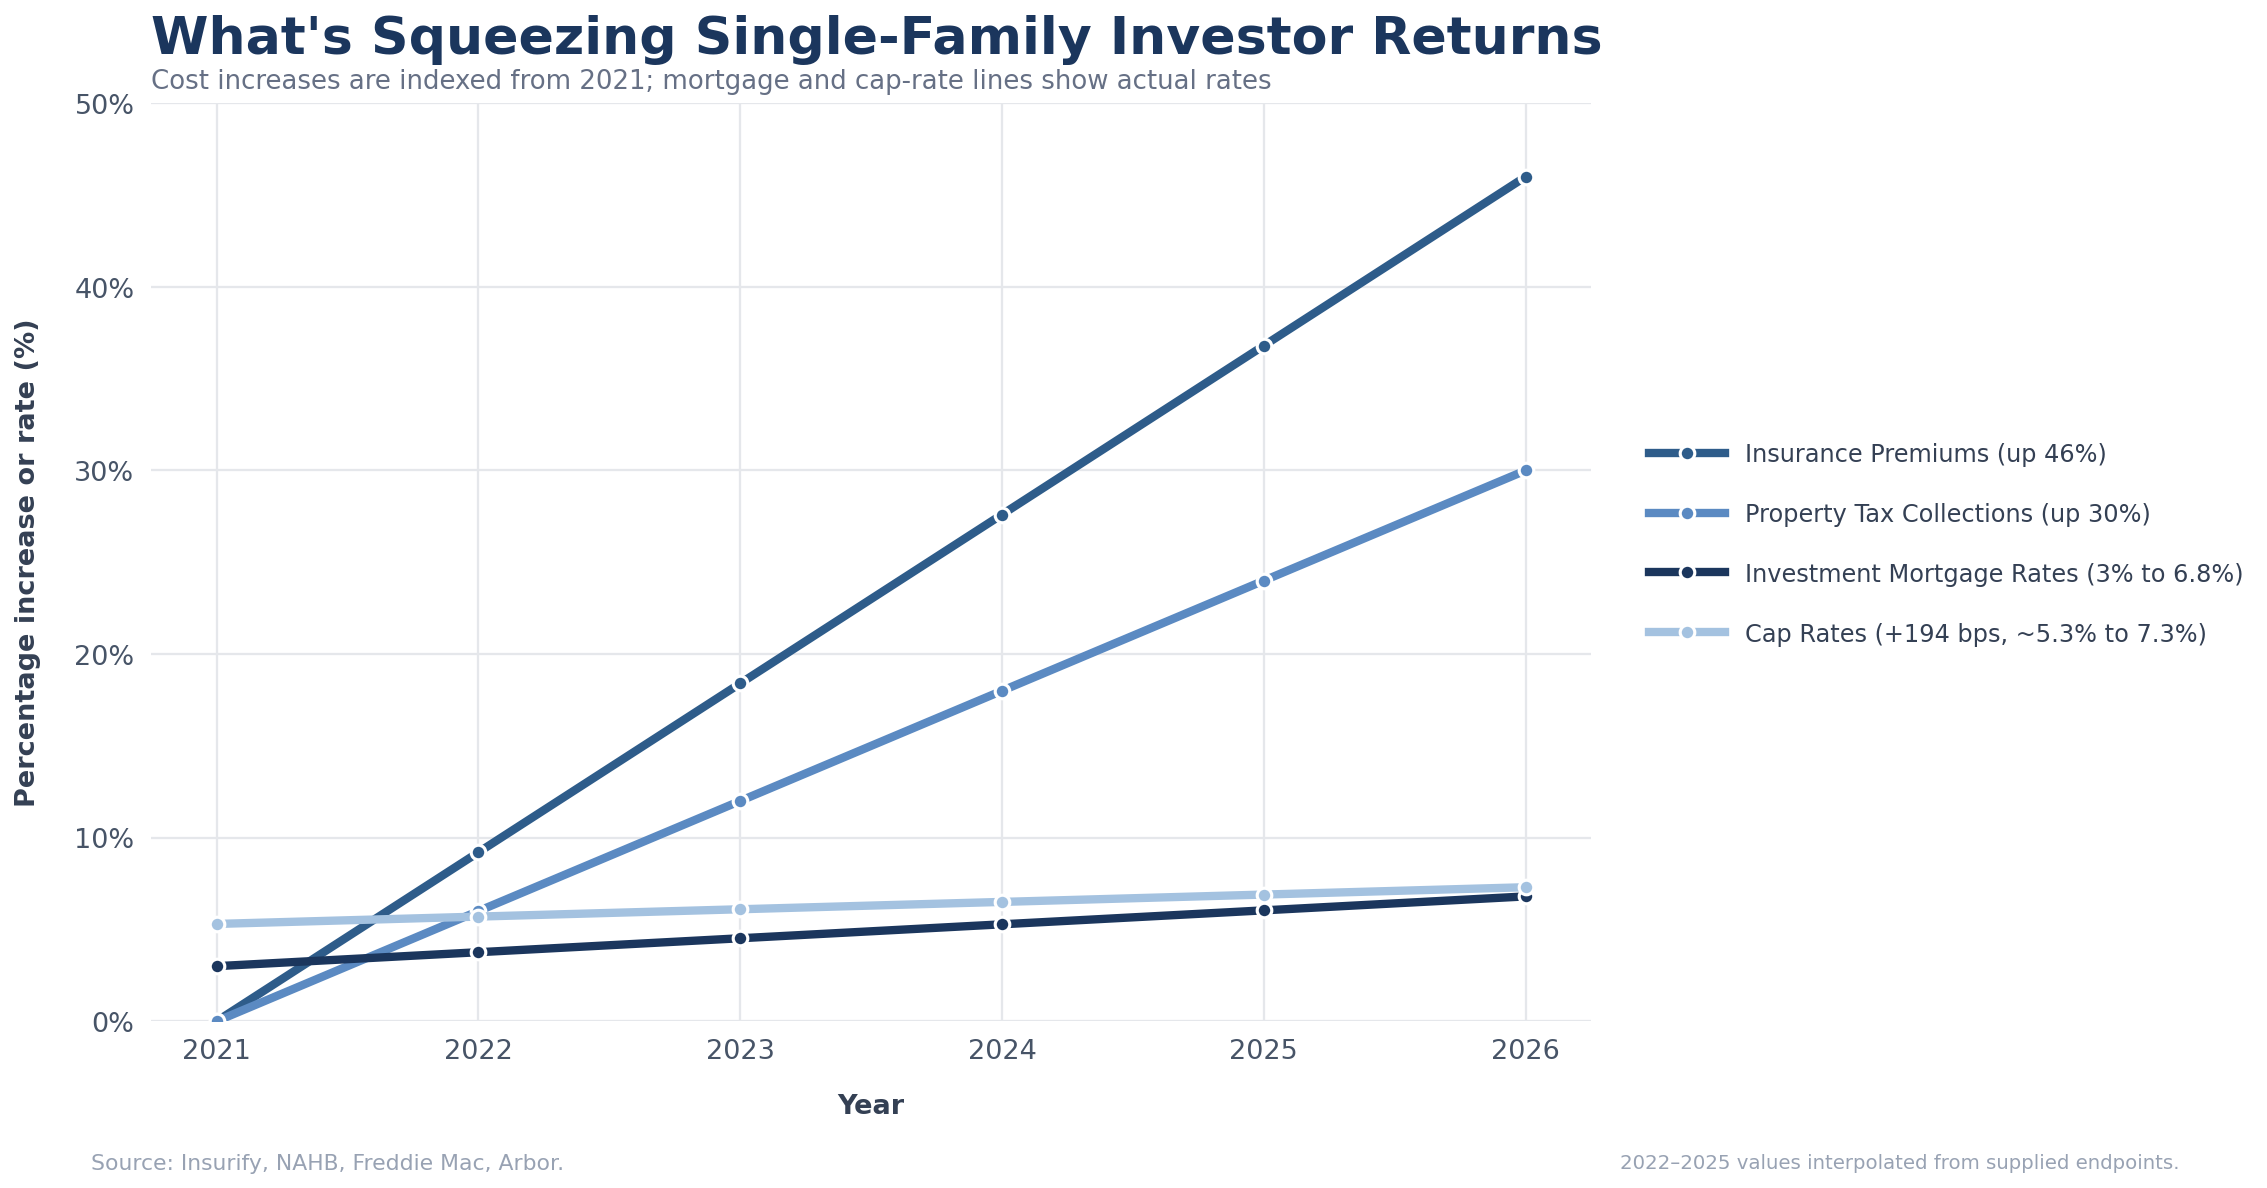
"Insurance premiums, property tax collections, and investment mortgage rates have all climbed steeply since 2021, compressing the cash-flow margin for leveraged rental property investors.
Rising borrowing costs and debt-service requirements narrow leveraged returns, forcing rental property investors to become more selective
Cap rates measure the return generated by a property's net operating income relative to its purchase price. A 7.3% cap rate sounds attractive. But cap rates alone do not tell the full story for leveraged investors. What matters is the cash flow that remains after debt service, operating reserves, and capital expenditure funding.
The pressure now comes from the relationship between net operating income and debt service. Investment-property mortgage rates are running near 6.8% or higher. Most lenders require meaningful down payments and enforce minimum debt-service coverage ratios. Once amortization and capital expenditure reserves are included, an apparently attractive 7.3% cap rate may still produce limited cash flow for investors using leverage.
Rental property investors have felt this dynamic most acutely. Cap rates climbed to 7.3% in the fourth quarter of 2025, up nearly 2% from pandemic lows. That recovery appeared promising. But leveraged economics tell a different story.
The Math Behind the Margin
A $350,000 property producing a 7.3% cap rate generates approximately $25,550 in annual net operating income. A properly calculated NOI already deducts expected operating expenses, including property taxes, insurance, routine maintenance, management, vacancy allowance, and investor-paid utilities.
With a 20% down payment, the investor finances $280,000. At 6.8% interest amortized over 30 years, annual debt service is approximately $21,900. That leaves roughly $3,650 before income taxes, capital expenditures, and replacement reserves. The resulting debt-service coverage ratio is approximately 1.17, leaving little protection against unexpected vacancies, repairs, or operating-cost increases.
This illustrates why leveraged rental property investors are becoming more selective. When borrowing costs were closer to 3%, debt service consumed a smaller percentage of NOI, even when cap rates were lower. Today, rising operating expenses can reduce NOI while elevated debt service limits the property's remaining cash flow.
Insurance Costs Accelerating
Home insurance premiums have climbed 46% since 2021, according to Insurify. The average annual premium increased 12% in 2025 to $2,948. Insurify projects another 4% increase by the end of 2026, bringing the national average to approximately $3,057.
For a rental property generating $2,500 in monthly income, a $3,057 annual insurance premium equals approximately 10% of gross rental income. Actual insurance costs vary by location, coverage, property condition, and weather exposure. Rising premiums, larger deductibles, and narrower coverage can reduce NOI and increase the amount investors must maintain in reserves
Property Tax Reassessment Risk
State and local property-tax collections reached $797 billion in 2024, an 8.2% increase from the prior year. However, reassessment practices vary significantly by jurisdiction. Some areas reassess after a sale, while others limit annual increases or follow fixed reassessment cycles.
For investors, the primary underwriting risk is relying on the seller's current tax bill. A transfer of ownership may trigger a higher taxable value in certain jurisdictions, reducing the property's projected NOI. Investors should estimate the post-acquisition tax bill instead of assuming the existing assessment will remain in place.
Utility and Operating Cost Pressures
Utility expenses vary substantially by market and lease structure. When investors pay water, sewer, gas, or electricity, rate increases flow directly through the property's NOI. Older rental properties may face additional pressure from inefficient heating systems, aging plumbing, deferred maintenance, and larger replacement costs.
National averages provide context, but investors must underwrite utilities, routine repairs, and future capital expenditures at the individual-property level. These costs compound over time. A property that works at current expense levels may not work if utility rates, insurance premiums, or maintenance costs climb faster than rents.
Investor Market Shift
Redfin reported that investor home purchases increased a modest 2% year over year in the fourth quarter of 2025. Meanwhile, BatchData found that large institutional investors sold more homes than they purchased throughout 2025.
These datasets use different investor definitions, but together they suggest that overall investor activity remains steady while the largest buyers are exercising greater discipline. Properties requiring substantial capital improvements, carrying unusually high insurance costs, or facing potential property-tax resets may require lower purchase prices or larger down payments to meet return and debt-coverage targets.
The impact is property-specific. Investors are increasingly concentrating on rentals with durable demand, predictable expenses, limited deferred maintenance, and enough NOI to withstand higher borrowing and operating costs. In secondary and tertiary markets, properties available for cash acquisition without institutional financing contingencies, distressed homes, and inherited properties tied to probate timelines now operate with reduced institutional buyer density.
ABOUT
Buys Houses is a cash home buyers company serving Pittsburgh and western Pennsylvania. The company acquires inherited properties, distressed homes, and as-is sales across Allegheny, Washington, Beaver, and Westmoreland Counties. When you need to sell quickly, buys houses specialists handle the transaction without appraisal contingencies, inspection renegotiations, or financing delays. We buy houses in Pittsburgh and surrounding areas with cash offers in 24 hours. Let us do all the work so you don't have to. Buys Houses making a difference in Pittsburgh and surrounding areas. Contact 412-561-9833 or visit buyshouses.co.
Carlo Finotti
Buys Houses
+1 412-561-9833
email us here
Visit us on social media:
LinkedIn
Instagram
Facebook
YouTube
Other
Legal Disclaimer:
EIN Presswire provides this news content "as is" without warranty of any kind. We do not accept any responsibility or liability for the accuracy, content, images, videos, licenses, completeness, legality, or reliability of the information contained in this article. If you have any complaints or copyright issues related to this article, kindly contact the author above.
